







The Sports Economy Index (SEI)
framework
overview
A rigorous, data-driven methodology underpins the Sports Economy Index, giving policymakers and stakeholders a consistent way to compare countries, identify gaps, and prioritize action.
4
Pillars

46
Pillar KPIs

9
Enablers

50
Enablers KPIs

40+
Data sources

Four economies.
Nine enablers. One index.
Scroll through each economy to see its KPIs, the enablers that power it, and the macro outcomes it drives. The diagram on the left stays pinned so you can track your position in the framework.
Pillars
PARTICIPATION
Movement economy
14 KPIs

Consumption
Experience economy
10 KPIs

Innovation
Imagination economy
10 KPIs

Amplification
Influence economy
12 KPIs

Enablers
High performance talent
4 KPIs

Talent development
4 KPIs

Physical infrastructure
10 KPIs

Tech and data
9 KPIs

Partnerships
6 KPIs

Healthcare
4 KPIs

Policies and regulations
5 KPIs

Funding
4 KPIs

Sustainability
4 KPIs

Macro impact
Economic
Captures GDP and employment generated by the sports economies.

Social
Captures wider societal benefits such as wellbeing and social cohesion generated by the sports economies.

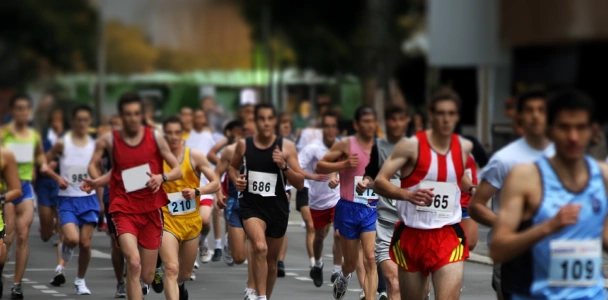
-
- K.01 Percentage of adults who get at least 150' of physical activity a week %
- K.02 Percentage of male adults who get at least 150' of physical activity a week %
- K.03 Percentage of female adults who get at least 150' of physical activity a week %
- K.04 Percentage of population that walks to commute %
- K.05 Percentage of population that cycles to commute %
- K.06 Number of members at gyms / fitness clubs #
- K.07 Gym or fitness club membership rate %
-
- K.08 Youth sports participation %
- K.09 Youth sports participation (male) %
- K.10 Youth sports participation (female) %
-
- K.11 Sports nutrition market size USD Mn
- K.12 Consumer spending on apparel / gear USD Mn
- K.13 Consumer spending on gyms and memberships USD Mn
- K.14 Consumer spending on wearables USD Mn

-
- K.01 Sports tourism market size USD Mn
- K.02 Tourism flows: international arrivals #
-
- K.03 Professional league attendance #
- K.04 Mega event attendance #
- K.05 Number of mega event days, since 2010 #
- K.06 Number of major events #
-
- K.07 Sponsorship market size USD Mn
- K.08 Brand licensing market sales revenue USD Mn
- K.09 Merchandise market size USD Mn
- K.10 Ticketing market size USD Mn

-
- K.01 Number of SportsTech startups #
- K.02 Investment in sports-related startups USD Mn
- K.03 Total valuation of sports-related ventures USD Mn
-
- K.04 Number of sports leagues or events founded #
- K.05 Number of sports patents, copyrights, or trademarks #
- K.06 Number of sports innovation centers #
- K.07 Number of science journal articles #
- K.08 Researchers per 1 million population #
- K.09 R&D spending as a share of GDP %
- K.10 Global Innovation Index ranking #

-
- K.01 Telecom and pay TV services market size USD Mn
- K.02 Media rights market valuation USD Mn
- K.03 Country CPM for YouTube USD
- K.04 Advertising market value USD Mn
- K.05 Sports streaming market value USD Mn
-
- K.06 Paid sports app market size USD Mn
- K.07 Sports app market share in the region %
-
- K.08 Number of X followers - Olympic national team #
- K.09 Number of X followers - National federations (Top 5) #
- K.10 Number of X followers - Athletes (Top 5) #
- K.11 Number of X followers - Media outlets (Top 3) #
- K.12 Total content creation market size USD Mn
Enablers shaping this economy
These are the policy levers governments can directly invest in or regulate to improve this pillar's score.
-
- K.01 Number of Olympic athletes #
- K.02 Number of Olympic medals, including Summer, Winter and Youth Olympics #
- K.03 Total FIFA World Cup points #
- K.04 Number of professional leagues #

-
- K.05 Number of coaches, trainers and referees #
- K.06 Number of graduates from sports-related fields #
- K.07 Number of jobs in sports industry #
- K.08 Physiotherapists per 100,000 population #

Super-enablers are critical because they have an outsized influence on the performance of the four core sports economies.

-
- K.01 Number of tier 1 venues available (>30k seats) #
- K.02 Number of seats in tier 1 venues #
- K.03 Number of tier 1 seats per 1 million population #
-
- K.04 Distance of walking and cycling networks per 1000 population km
- K.05 Infrastructure spending as a share of GDP %
-
- K.06 Total number of sports fields #
- K.07 Number of local clubs score Scale (1-3)
-
- K.08 Size of high performance training center km²
-
- K.09 Number of higher education institutions #
-
- K.10 Cubic meters of renewable freshwater per capita mt³

-
- K.01 Percentage of population with access to internet %
- K.02 Average internet speed Mbps
- K.03 Cybersecurity readiness / data protection index Scale (1-5)
- K.04 Information and communication spending as a share of GDP %
-
- K.05 Number of sports innovation hubs / accelerators #
- K.06 Number of patents/publications in sports technology/wearables #
- K.07 Percentage of clubs/leagues using wearables/analytics %
-
- K.08 Percentage of clubs/leagues using wearables/analytics %
- K.09 Stadiums using smart infrastructure score Scale (1-5)
- K.10 Digital fan engagement score, including OTT sports subscriptions and app usage Scale (1-5)

-
- K.01 Number of sector-specific government entities score Scale (1-3)
- K.02 Number of cross-sectoral government entities score Scale (1-3)
- K.03 Partnerships with academia score Scale (1-3)
- K.04 Number of sports federations and organizations score Scale (1-3)
- K.05 Partnerships with local clubs score Scale (1-3)
- K.06 Sports medicine market size USD Mn

-
- K.01 Number of physiotherapists per 100,000 population #
- K.02 Sports nutrition market size USD Mn
-
- K.03 Food security index score Scale (1-100)
- K.04 Dedicated body for sports governance score Scale (1-2)
-
- K.01 National sports strategy score Scale (1-2)
-
- K.02 Strength of intellectual property protection %
-
- K.03 Ease of doing business index Scale (1-100)
- K.04 Migrant integration policy index MIPEX Score
-
- K.05 Total government expenditure on sports USD Mn

-
- K.01 Number of venture capital deals per USD billion #
-
- K.02 Private equity market size USD Mn
- K.03 Disposable household income USD
-
- K.04 Environmental performance index solid waste score Scale (1-100)
-
- K.01 Percentage of population exposed to more than 10 micrograms/m³ %
- K.02 Inclusiveness index Scale (1-5)
-
- K.03 Labor rights index Scale (1-5)
From Enablers to Macroeconomic Impact
Policy actions on enablers can raise a country's Sports Economy Index (SEI), improve its ranking, and unlock economic and social gains. Strengthening enablers like talent development and infrastructure leads to direct gains in the sports economy and broader national returns.
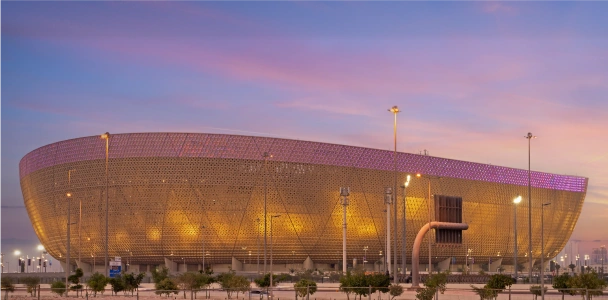

Countries that strengthen enablers can expect both direct sports economy gains and wider economic and social returns
How the Sports Economy Index is built
The Sports Economy Index uses a data-driven method to support credible comparison, practical benchmarking, and decision-useful insights for policymakers.

Step 1
Index definition
- Vision and objectives
- Framework and indicators
- Country prioritization and selection
Step 2
Index development
- Benchmarking and data collection
- Surveys/interviews (as needed)
- Calculation formulas
- Score calculation
Step 3
Report development
- Insight extraction
- Key findings report
- Interactive SEI tool design and publishing
Step 4
Impact measurement
- Statistical analysis linking impact outcomes to framework results

Index score calculation
To enable cross-country comparison, all indicators are normalized using the min-max method, transforming raw values onto a standardized 0-100 scale, where 0 represents the lowest-performing country and 100 the highest-performing country for each indicator.
Step 01
Normalize KPIs
Indicator normalization using the min-max method
To ensure comparability across countries and indicators that naturally differ in units and scale, SEI applies a 0-100 min-max normalization method.
46 KPIs
Step 02
Aggregate into pillars
Aggregate into pillars
Normalized KPIs are averaged (or weighted where defined) to produce four pillar scores — Movement, Experience, Imagination, and Influence — each on a 0-100 scale.
0 → 100
Step 03
Derive overall SEI score
Derive overall SEI score
The four pillar scores are summed to produce each country's overall Sports Economy Index score, enabling cross-country comparison and ranking.
Avg / weighted


Data Sources
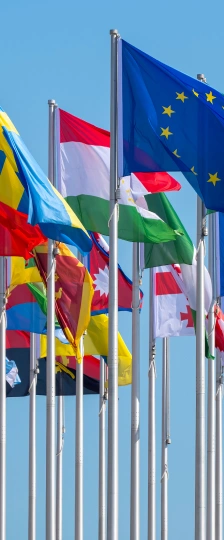
A range of sources were selected to enable consistent international benchmarking across markets, drawing on global institutions, national statistical bodies and specialist industry sources with internationally comparable data.
Inter-government and multilateral
National Government
Industry bodies and federations
Market research and intelligence
News, PR and media
Data disclaimer
The Sports Economy Index uses the latest available public, industry, and proprietary data sources. Results are directional and designed for benchmarking, simulation, and strategic planning. Scores may change as new data, methodologies, or country-level information becomes available.
Menu