
Disciplined syndicates are best placed to return to profitable growth following the pandemic
As the economy adjusts to the disruption caused by COVID-19, many commercial lines insurers will be looking for measures to return to profitable growth and improve the consistency of their performance. Understanding the key drivers of long-term profitability in the market will be essential to achieving these goals.
Using historical data from Lloyd’s of London, we have sought to uncover key performance drivers and to test the validity of existing theories regarding profitability. One clear message emerges from our analysis and discussions with industry experts: discipline delivers results. Profitable growth is an outcome of combining a disciplined culture with a clear underwriting strategy, considered risk appetite and effective controls.
Commercial lines insurers should prioritise embedding discipline into their organisations as they look to capitalise on the rapidly hardening market conditions.
Lloyd’s offers attractive opportunities over the long run
Lloyd’s of London is the largest single global specialty commercial lines insurance hub in the world, enabled by its unique capital structure and international network of brokers and licenses. Syndicates that participate in this marketplace have access to some of the most complex and uncommon commercial risks. While the market is profitable in the majority of years, its exposure to major events creates significant volatility and periods of poor performance. COVID-19 represents another of these major events that will lead to a spike in losses (Lloyd’s expects a net ultimate loss of £3bn due to COVID-19[1]).
While many syndicates will be justified in blaming poor 2020 results on Lloyd’s exposure to the pandemic, historical data reveals that over the long run they may have greater control over their combined ratio (COR) than previously thought. Understanding and acting on the key drivers of profitability within the Lloyd's market will be essential as insurers look to adapt to and transform for new market conditions.
Source: Lloyd's of London Market Statistics 2020; Strategy& analysis
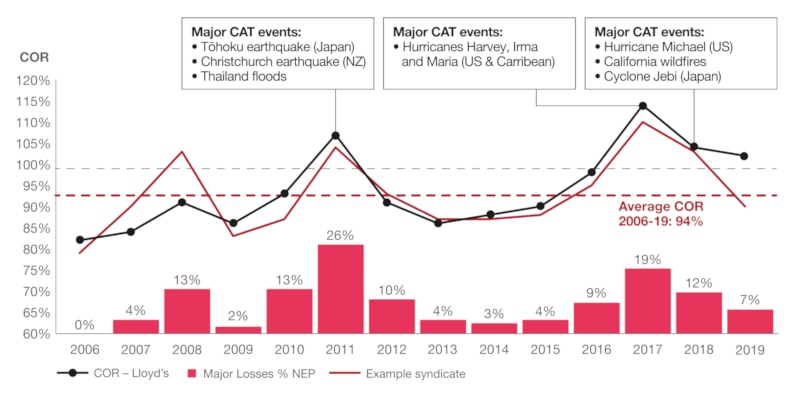
Over the long run the market has proven to be profitable. Indeed, over the past 14 years, the average COR across all Lloyd’s syndicates was 94%. This is despite four years in which spikes in major losses due to natural catastrophes, as indicated by upticks in major losses as a share of NEP, have caused the market COR to be greater than 100%. The market has a history of bouncing back quickly from loss-making years, and 2021 is expected to be no different with a forecast[2] of 12% to 13% premium growth. While the occurrence of catastrophic events cannot be predicted and the average syndicate may not be profitable every year, over the long run Lloyd’s represents an attractive market.
Leading syndicates have achieved consistent profitability, independent of cession rate, business mix and scale
Performance and volatility can be actively managed independent of size

Source: Lloyd's of London Market Statistics 2020; Strategy& analysis
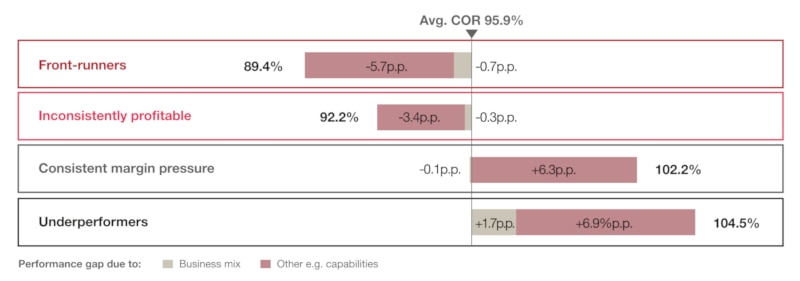
Furthermore, leading syndicates of a range of sizes have been able to achieve long-run profitability and limited performance volatility. For syndicates with an average GWP of at least £300m over 2010-19, market data shows the average COR against the volatility in COR for 2010-2019. As we would expect for participants in the specialty lines market, all syndicates experience some degree of volatility. However, there are also significant differences in the levels of volatility and profitability achieved. From this chart four performance groups emerge:
- Front-runners: Highly profitable and relatively stable performance year-to-year
- Inconsistently profitable: Profitable in the long run with a small number of loss-making years
- Consistent margin pressure: Loss-making on average with limited performance volatility
- Underperformers: Loss-making and high performance volatility
The differences in long run performance between these groups challenge the common assumption in the market that control over performance in Lloyd’s is limited due to the unpredictable nature of catastrophic events. Analysis of historical data reveals three findings in relation to profitability drivers:
- Business mix has a small impact on long-term profitability
- Consistently profitable performance is achievable at various cession levels
- ‘Front-runners’ only pursue scale when the market conditions are favourable
Business mix has a small impact on long-term profitability
Source: Lloyd's of London Market Statistics 2020; Strategy& analysis
A common belief in the market is that differences in profitability between syndicates are predominantly driven by business mix differences. This is because the average profitability of each line of business (LOB) varies significantly year-to-year and each syndicate’s mix is unique.
However, data shows that over the past 10 years business mix has only a minor impact on the long-run profitability of a syndicate. By comparing each syndicate’s performance against the industry average for their precise business mix we can isolate to what extent their performance gap vs. the market average is due to business mix. Market data shows business mix has at most a minor impact on performance, with the ‘front-runners’ group benefitting by an average of 0.7% from a favourable business mix. This leaves a further performance gap of 5.7% which is not due to business mix. The same is true for the other performance groups; indeed the ‘consistent margin pressure’ cohort actually benefited slightly from their business mix despite having an average COR of 102.2% (6.4% above average).
Consistently profitable performance is achievable at various cession levels

Source: Lloyd's of London Market Statistics 2020; Strategy& analysis
Given the primary reason for buying reinsurance is to lower earnings volatility, there is an understandable perception that a higher amount of outwards reinsurance would on average deliver lower earnings volatility. This is coupled with beliefs that insurers are able to get “value” from reinsurers (i.e. premiums equivalent to loss coverage) and that higher levels of reinsurance are linked to greater levels of profitability. Interestingly, these beliefs do not appear to be true in the Lloyd’s market. Average cession rates are remarkably consistent at 22% to 24% across all four performance groups, despite the significantly higher volatility seen by the underperformers relative to the front-runners. It is clear the front-runners are not simply ceding more risks to reduce volatility; and vice-versa, that increasing the cession rate of underperformers will not directly lead to lower earnings volatility. Similarly, the same data shows that there is no link between how much reinsurance a syndicate buys on average and long-term underwriting profitability.
When it comes to purchasing outwards reinsurance, market data shows stability in the cession rate is highly correlated with performance. Indeed, as we move down the performance groups from best to worst performing, the volatility of the cession rate increases. This is symptomatic of better performing syndicates having a consistent outwards reinsurance purchasing strategy linked closely to their underwriting strategy and plans, whereas poor performers have a more reactionary approach to purchasing reinsurance.
If neither reinsurance usage nor business mix are the cause of persistent performance differences between syndicates, what is? As alluded to previously, the answer is likely to lie internally, within the syndicates.
Leading players only pursue scale when the market conditions are favourable

Source: Lloyd's of London Market Statistics 2020; Strategy& analysis
Top performers in Lloyd’s show restraint and control in only choosing to expand capacity when it can be done profitably. Lloyd’s undertakes an annual process of setting the capacity for each syndicate for the following year, with more profitable syndicates often given a higher capacity as a reward for high performance. However, top performers exhibit restraint in requesting capacity increases, only doing so in hard markets in which they perceive an opportunity for profitable expansion. Industry discussions should not focus on scale, but on ‘efficient scale’.
In the ‘hard’ market between 2009 and 2012, when rates were growing, ‘front-runner’ syndicates grew capacity aggressively; however, when rates were falling from 2013 to 2017 there was less capacity growth across all four syndicates (see the above chart illustrating the yearly capacity changes for four of the syndicates within the ‘frontrunners’ performance group). This shows restraint in expanding capacity only when it is favourable to do so.
This restraint in expanding capacity is a result of the strong discipline and control exhibited by top performers in taking on and managing risks. These syndicates will not seek expansion for the sake of expansion. They will expand only if it can be done so in a controlled way which is consistent with their existing underwriting policies and set in a context of rising rates.
Front-runners share strong discipline as a key characteristic across their organisations
Obsessing over cession levels, business mix and scale does not appear to deliver consistently better performance. Instead, sustainably lower CORs have been delivered by ‘front-runners’ that share discipline and restraint as common traits. Syndicates looking to successfully weather the impact of the pandemic should focus on instituting these traits across five key elements of their business:
- 1. Underwriting and pricing
- 2. Active portfolio management
- 3. Planning and controls
- 4. Risk appetite
- 5. Culture and empowerment
1. Underwriting and pricing
Underwriters should have access to, and use, modern pricing and risk assessment tools that integrate up-to-date third party data sources. Underwriters should be empowered to operate within a controlled environment. Tools should be combined with their own knowledge and experience to write each open market risk with a clear rationale and suitable terms and conditions.
2. Active portfolio management
Strong pre-bind controls (e.g. contractual terms) and post-bind controls (e.g. zero tolerance for incomplete / late audits) should be used to limit scope for reckless decisions from agents. End-to-end performance reviews of MGAs should be used regularly by underwriting leaders and central delegation teams to ensure adherence to contractual agreement.
3. Planning and controls
Prudent planning and appropriate use of reserve releases, relative to the business environment, should enable sustainable performance. Clear risk and control measures, which apply system-enforced controls where possible, should minimise deviations to the underwriting strategy and risk appetite.
4. Risk appetite
A steady, long-term risk appetite which is well understood throughout the organisation, coupled with a clear articulation of suitable lead syndicates, should be developed to create clarity and consistency across the organisation. Portfolios should be monitored continuously to enable the organisation to ‘dial up or down’ between business lines and risks.
5. Culture and empowerment
Leadership intervention should be encouraged where there is misalignment on key organisational behaviours. Top talent should be identified and nurtured carefully (e.g. learning programmes for underwriters) to create a high performance environment.
Discipline across these core components is a prerequisite to achieve efficient scale. On average, the ‘front-runners’ that demonstrated these traits grew gross premiums by 5% per year with a COR of 89% between 2010 and 2019. A handful of syndicates more than doubled gross premiums over the period while also achieving some of the lowest CORs in the market.
Achieving discipline across the core components requires commercial lines insurers to develop a robust strategy and operating model that creates clear accountability across the organisation. For some this will require full-scale transformation while others may just require targeted interventions; only the recklessly idle would risk standing still and doing nothing.


Contact us


Follow us


