Why eSAF is at a crossroads
Aviation is one of the hardest sectors to decarbonize, and synthetic fuels made from green hydrogen and captured CO₂, known as eSAF (e-Sustainable Aviation Fuel), are central to Europe's plan. Under the EU's ReFuelEU Aviation and UK’s SAF Mandate, fuel suppliers in EU and UK must blend approximately 660,000 tons of eSAF by 2030, rising to more than 1 million tons by 2032.
European companies have responded with ambition: projects under development today could produce more than 2 million tons of eSAF per year. Yet fewer than 10% of projects have advanced to Front-End Engineering Design (FEED) stage, and not a single large-scale plant has reached Final Investment Decision (FID) in Europe. The total capacity in FEED is less than half the required mandate for 2030, and timelines are approaching fast.
Europe will have to overcome multiple challenges to unlock multi-billion-euro investments across the value chain and scale competitive eSAF. We see three main elements to advance the sector: (i) demand certainty, (ii) long-term contract de-risking, and (iii) supply certainty. ReFuelEU provides a stable demand outlook, while risk sharing proposals such as revenue certainty mechanisms are under discussion. The focus of this article is on supply certainty, specifically the importance of price transparency for eSAF offtakers, investors and financial institutions.
In the nascent eSAF market, offtakers face significant uncertainty over which projects will succeed, yet are being asked to make large, long-term commitments years before production begins. With few operational projects to benchmark against, comparing production costs across technologies, feedstocks, subsidies and regulatory schemes remains difficult, further slowing offtake decisions.
Public estimates for eSAF production costs in Europe vary widely, from €4,000 to more than €9,000 per ton. Because underlying assumptions are often undisclosed, this range creates uncertainty, increases perceived risk, delays offtake decisions, and slows projects in the development funnel.
This article supports decision-making by bringing clarity and confidence to eSAF production costs, competitiveness drivers, and emerging revenue levels that are required to make investments viable. It is based on a bottom-up assessment of production costs across technologies, regions, project scales, and financial assumptions, providing market participants, investors, and policymakers with a transparent reference point.
Greater transparency on eSAF pricing is essential to reduce the initial price hurdle, unlock large-scale investment, and move projects through the development funnel. As projects reach Commercial Operations Date (COD), production scales up and supply chains mature, price dispersion should narrow and operating assets should be refinanced at a lower cost of capital. To start this virtuous cycle, market participants need a clearer understanding of the key drivers of eSAF costs.
What elements drive the cost of eSAF?
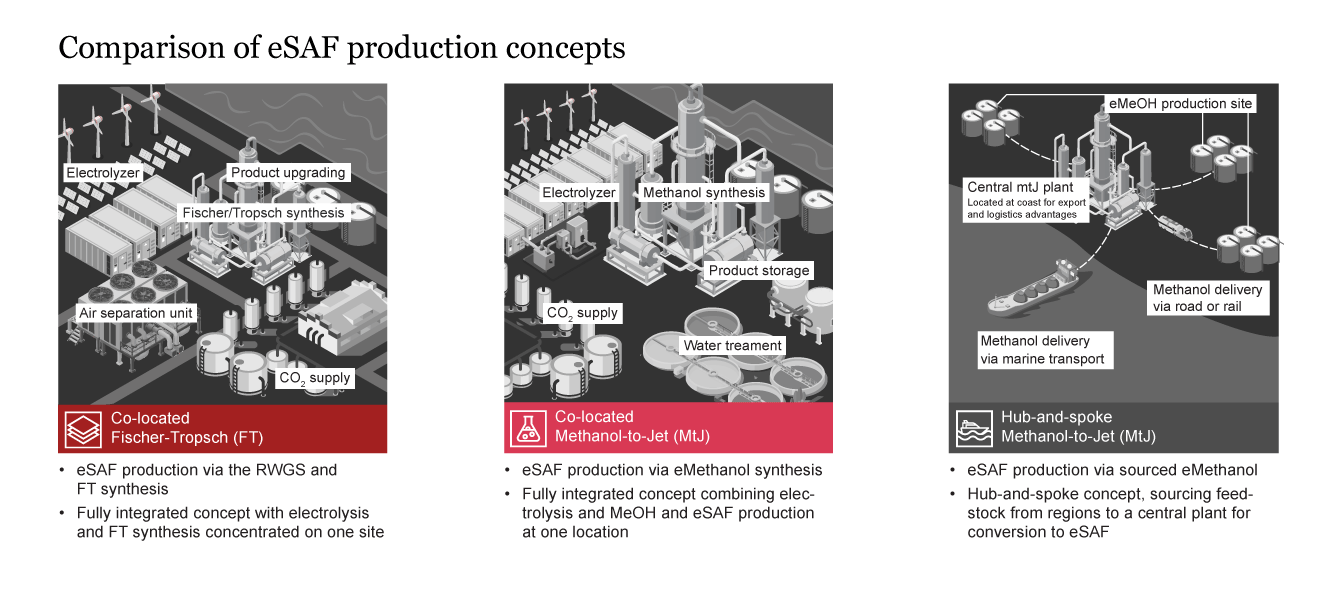
Like any hydrocarbon, eSAF is produced from a combination of feedstock, energy, and capital. Synthesis plants use electricity to convert green hydrogen and captured CO2 into liquid hydrocarbons, including aviation fuel and other by-products. Most eSAF projects today follow one of two technology pathways: Fischer-Tropsch (FT) or Methanol-to-Jet (MtJ).
In the Fischer-Tropsch pathway, green hydrogen and captured CO2 are first converted into syngas via Reverse Water Gas Shift (RWGS) reaction. The syngas is then transformed into hydrocarbons through Fischer-Tropsch synthesis and upgraded into aviation-grade eSAF.
In the Methanol-to-Jet pathway, renewable hydrogen and captured CO2 are first converted into methanol. Methanol is subsequently transformed into jet-range hydrocarbons through a series of catalytic upgrading steps and refined into eSAF. Some eSAF plants synthesize methanol themselves, under a ‘Co-located’ model. Other plants source methanol from third parties, under a ‘Hub & Spoke’ model.
Since European regulators introduced eSAF mandates, market debate has increasingly focused on the “winning technology”: which pathway can deliver eSAF at the lowest overall cost. Our assessment indicates that Fischer-Tropsch and Methanol-to-Jet are expected to reach broadly comparable price points. While Fischer-Tropsch can be more feedstock-intensive1, Methanol-to-Jet typically requires higher capital expenditure, resulting in similar levelized costs of eSAF (see Figure 1).
Rather than framing the debate as a choice between competing technologies, the focus should be on project-specific competitiveness. Both pathways have a role to play in scaling eSAF supply in Europe.
If we move beyond the technology pathway discussion, what actually drives the cost of eSAF?
- Renewable power is ultimately the most relevant element of the eSAF cost build-up, as it determines the cost of green hydrogen, which in turn represents up to 60% of total production costs. Direct access to low-cost renewable power or access to feedstock produced in low-cost regions significantly influence the production cost of eSAF
- CapEx and DevEx can represent up to a third of levelized eSAF costs, driven not only by the physical infrastructure required, but also by EPC management contracts, contingencies and owner’s costs
- Carbon sourcing costs represent only 5-10% of levelized costs in the base case, but can vary significantly based on the source, transportation and treatment of CO2 streams
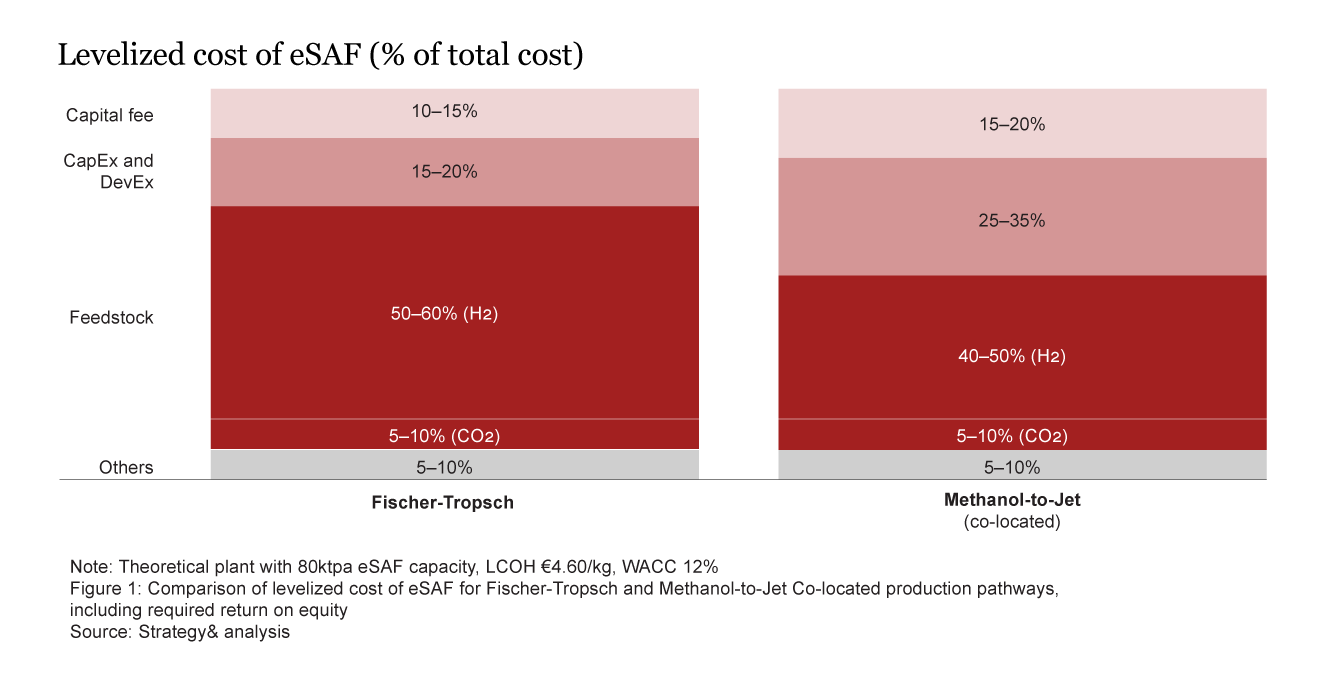
1 Assuming no recycling of byproducts and eSAF selectivity of c.80% for Fischer-Tropsch. In case of eNaphtha recycling for Fischer-Tropsch, selectivity increases and feedstock intensity approaches MtJ
Demystifying the price point: why do eSAF quotes vary so much?
Our analysis shows that project fundamentals can explain up to a 45% spread in levelized cost2 for eSAF produced in Europe. The main drivers of competitiveness are:
- Access to low-cost renewable power or low-cost green hydrogen: projects in regions with low-cost renewable power, or those sourcing methanol via a Hub & Spoke model, can deliver up to 25% lower levelized costs.
- Project scale: larger projects benefit from scale advantages, as unproductive OSBL3 will take up a relatively lower share of total CapEx in larger plants and ISBL4 will also not scale linearly with output. We estimate an impact of 10% in levelized eSAF cost by growing the plant output from 80ktpa to 250ktpa5.
- Cost of financing: projects which can reduce cost of capital by de-risking the development phase (e.g., via CapEx subsidies) or sharing offtake risk (e.g., via revenue certainty mechanisms) can achieve up to 10% lower levelized cost of eSAF.
Although subsidies play an important role in enhancing project credibility, signaling public commitment and improving bankability, direct CapEx subsidies at levels currently announced in Europe have only a marginal direct impact on levelized costs, with a few exceptions.
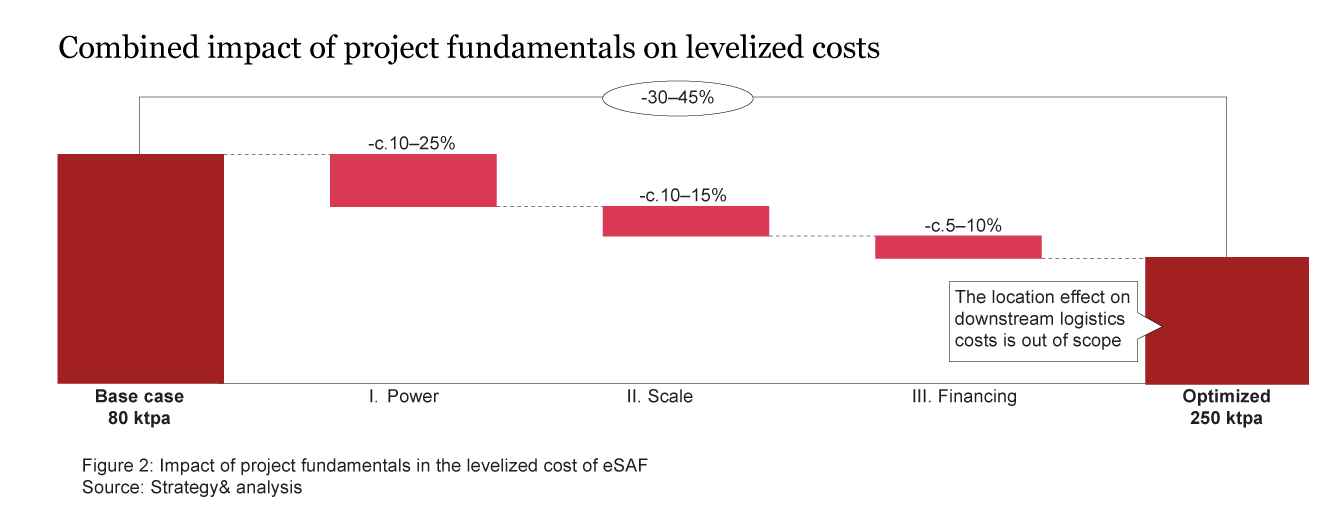
So why do quoted prices often diverge by more than 45%? Other factors can be at play, not related to project fundamentals:
- Inaccurate and/or immature CapEx estimates stemming from early-stage projects and underestimation of total project cost
- Aggressive financial assumptions, including cost of debt, gearing ratio and debt service ratio beyond market ranges
- Tactical pricing, often used in non-binding rounds of negotiation
2 Levelized costs include a return on equity required by investors
3 Outside Battery Limits
4 Inside Battery Limits
5 Larger projects also carry higher offtake and technology-integration risks, which need to be addressed separately
The global race: Europe must act to keep eSAF "Made in Europe"
Europe is home to approximately 3/4 of global eSAF projects, but it does not lead in production cost. Our should-cost model estimates production costs for eSAF in China and the United States, addressing the question: how does the production cost of eSAF in Europe compare to eSAF projects in China and the US?
- China combines low construction costs, shorter development timelines, and lower cost of capital. Levelized costs can be 25 to 50% lower than European projects.
- The United States benefits from cheaper renewable energy and slightly lower construction cost. Levelized costs can be up to 15% lower than European projects.
Project announcements in China and the United States raise questions on whether and when such volumes will be exported to Europe, given potential cost advantages. However, this threat is contingent not only on cost, but also on commercial operations date, certification requirements, import/export tariffs, logistics costs, among other factors.
European projects may be at a cost disadvantage, but other factors play in favor of European projects, including proximity to demand centers, potential for local job creation, and contribution to European energy security.
Conclusions and call to action
The eSAF industry sits at a critical juncture. Europe’s mandates created demand and developers built a pipeline with potential to produce over 2 million tons of eSAF per year, but no large-scale project has yet reached FID, held back, among other factors, by price uncertainty.
Our bottom-up analysis shows that clean power cost, scale and financing conditions can explain up to 45% variation in the levelized cost of eSAF. Further variations can be attributed to factors unrelated to project fundamentals, including immature CapEx estimates, aggressive financial assumptions, and tactical pricing.
While the European pipeline of eSAF projects progresses slowly towards FID, China and US projects raise questions on when volumes will enter the European market. To accelerate the progress of European eSAF projects and support a competitive 'Made in Europe' eSAF industry, European governments and regulators can focus on three priorities:
- Maintain stable demand frameworks: preserve ReFuelEU mandates and EU ETS carbon pricing; any weakening would delay FIDs already on the brink
- De-risk the development phase: expand direct CapEx support (Innovation Fund, national grants) and learn from other countries’ tax credits and industrial policy
- De-risk long-term contracts: introduce revenue certainty mechanisms such as Contracts for Difference and Guarantees, reducing exposure to volatile merchant pricing
Europe has signaled demand, and developers are taking investment risk on projects to cater for this demand. Now Europe must build confidence in its policy and its projects to convert significant eSAF latent capacity into investable reality.
Antonio Niemeyer and Anna Went also contributed to this article.